


Crypto analyst Killa has calculated a base Bitcoin bottom at $38,800 — a near‑50% fall from current levels — after benchmarking his cycle model to the $126,100 2025 peak and projecting a current‑cycle multiple of 3.25x.
Killa’s work follows his June 2025 prediction of a cycle top at $121,362, a call that missed the actually observed peak of $126,100 in October 2025 by about 3.9%. He also offered two nearby downside scenarios — $40,740 and $42,680 — to account for a 5% variance on the base target.
The numbers matter because Bitcoin has been volatile this year: CoinDesk reported Bitcoin trading near $78,000 on Friday after the market slid more than 50% from above $126,000 in October to around $60,000 in February, and in April the token briefly climbed back above $79,000 in a recovery from March lows; at the time of writing it was trading at $78,015.
Different analysts read the same price action in very different ways. CryptoBullet projects a final Wave Y leg down below $50,000 to as low as $45,000 and says the current bear phase could extend into the second half of 2026 before a bottom structure is complete. Michael Terpin, by contrast, projects a local bottom near $57,000 in October 2025 and argues a sustained recovery above $100,000 remains unlikely within 2025.
Killa’s bearish baseline springs from the same cycle‑analysis framework he used for his earlier top call; his model assumes each successive Bitcoin market cycle produces a smaller multiple relative to the prior cycle’s bottom. Using the $126,100 cycle high as the anchor, his 3.25x current‑cycle multiple returns the $38,800 floor and the nearby $40,740 and $42,680 scenarios.
The range of forecasts creates a sharp tension for traders. A move to $42,680 would require a roughly 45% drop from $78,015; Killa’s $38,800 target would be close to a 50% correction. CryptoBullet’s charting of a prolonged Wave Y descent points to a mid‑five‑figure wash‑out, while Terpin’s one‑year bottoming thesis centers the floor nearer to $57,000 — a substantially milder drawdown.
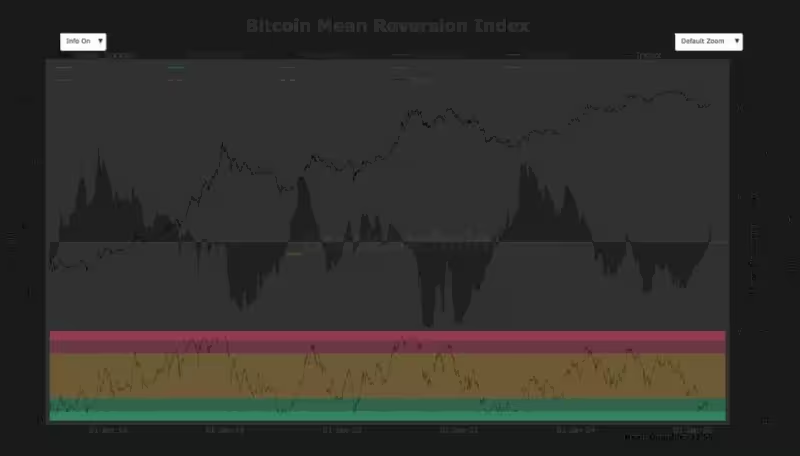
Not everyone views the deepest outcomes as likely. James Check warned that a slide to $40,000 would be an extreme statistical outlier, calling it "below any meaningful deviation across all major anchors." He added, "There’s no zero probability in markets," and said simply that "but this would be a near‑unprecedented outcome." Check framed a $40,000 scenario as a 0.4 event on his Bitcoin Mean Reversion Index — equivalent, on a relative basis, to Bitcoin trading below $2 in 2011.
Traders following charts on Tradingview are now parsing those competing maps in real time: Killa’s model permits a deep corrective reset if cycle math holds; CryptoBullet’s Elliott Wave reading suggests the structure of the decline is not yet complete; Terpin’s timetable leans toward a shallower, year‑long bottoming process. All three views are tethered to the same recent price history — the $126,100 October 2025 high and the subsequent slide toward $60,000 in February — but they point to dramatically different risk exposures for holders and short‑term traders.
The most consequential fact is where those forecasts cluster. With targets from $45,000 to $57,000 already standing in the public record, and Killa’s deeper $38,800 level flagged as an outlier by statistical analysis, the market’s next move will likely be judged against that band: a descent toward mid‑five figures would confirm the more bearish readings; stabilization above the upper end would favor the milder bottoming case. For traders watching price action on Tradingview, the question is no longer whether the debate exists but which map the market will follow.


